SP500 LDN TRADING UPDATE 14/01/25
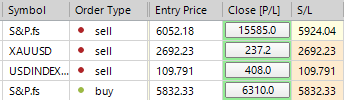
#SP500 LDN TRADING UPDATE 14/01/25
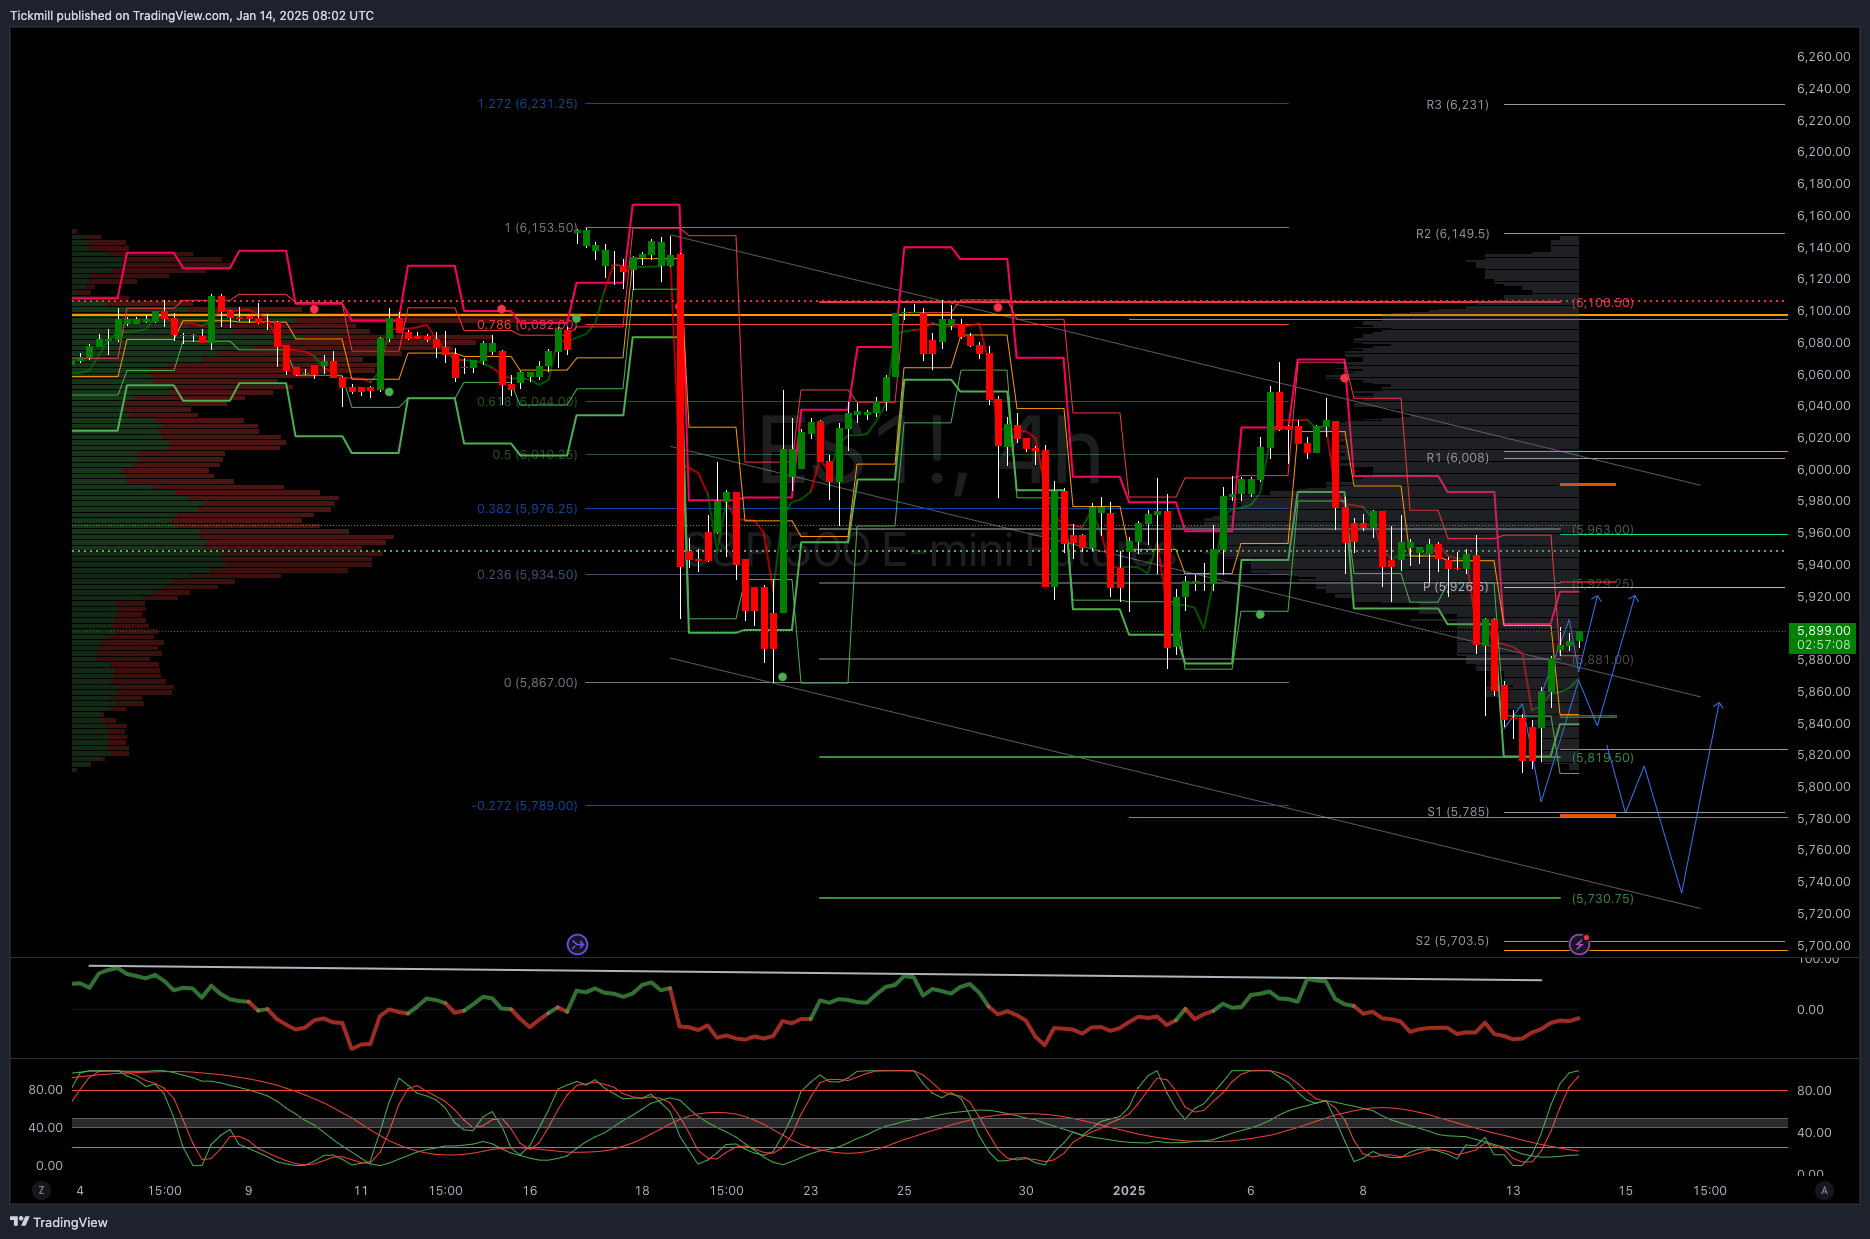
WEEKLY BULL BEAR ZONE 5905/15
WEEKLY RANGE RES 5983 SUP 5745
DAILY BULL BEAR ZONE 5864/74
DAILY RANGE RES 5923 RANGE SUP 5840
TODAY'S TRADE LEVELS & TARGETS
SHORT ON TEST/REJECT WEEKLY BULL BEAR ZONE TARGET DAILY BULL BEAR ZONE
LONG ON TEST/REJECT OF DAILY BULL BEAR ZONE TARGET WEEKLY BULL BEAR ZONE
LONG ON TEST/REJECT DAILY RANGE SUPPORT TARGET DAILY BULL BEAR ZONE
TO REVIEW WEEKLY ACTION AREAS & PRICE OBJECTIVE VIDEO CLCIK HERE
GOLDMAN SACHS TRADING DESK VIEWS
The intraday price movements are still quite similar to what we've observed in recent days, but they may be even more pronounced than what we experienced on Friday. The market dipped overnight, with both volatility and skew rising before the market opened. After the opening, volatility movements have been consistently downward, as both volatility and skew have trended lower. On Friday, this downward movement reversed towards the end of the day, but so far today, we've seen almost no rebounds in volatility as we approach the 100-day moving average in SPX spot. The recommendation from the desk remains unchanged: we favor spread trades over outright option trades, and we are inclined towards short volatility and short skew, as both are still at high levels compared to their trading ranges over the past year.
SPX ultimately up +16bps; equal weight up +82bps following Friday’s sell-off after the stronger payrolls report, as rising yields continue to impact sentiment and crude oil surges (~$78+) after the recent US sanctions on Russia (WTI back to October highs). Airlines dropped by -3% as the increase in crude prices begins to affect the sector through short-term EPS challenges. Interestingly, despite these movements, last week’s PB statistics are notable: US Energy stocks experienced net selling in each of the last five sessions, with the largest net selling in over three months (-2.5 SDs) – last week’s notional long selling in US Energy was the highest in more than eight years. The decline in Tech was driven by a catch-up in longer-duration segments of TMT (think: Non-Profitable Tech, Growth assets, etc.), which seems ‘directionally’ logical to many given the rise in rates we’ve observed. NVDA fell by -2% due to reports of Blackwell issues and White House restrictions on AI chips. It appears that most TMT investors are currently trying to navigate what is PRICED regarding 1Q guidance / 2025 forecasts, given the chaotic macro environment and modeling inputs.. adopting a 'wait-and-see' (Buy) strategy. Investors are remaining cautious ahead of the CPI report (and more broadly, the inauguration/tariff risks in the following week). We anticipate a 0.25% rise in core CPI (month-over-month SA), which would keep the year-over-year rate steady at a rounded 3.3%. Our baseline was a 6 on a 1-10 scale regarding overall activity levels. Overall executed flow concluded at -48bps compared to a +12bps 30-day average. LOs ended as $600m net sellers, influenced by macro expressions in tech and reduced supply in staples. LOs net purchased financials, consumer discretionary, and healthcare. HFs finished balanced overall, net sellers of tech against buyers of communication services, healthcare, and financials.
Disclaimer: The material provided is for information purposes only and should not be considered as investment advice. The views, information, or opinions expressed in the text belong solely to the author, and not to the author’s employer, organization, committee or other group or individual or company.
Past performance is not indicative of future results.
High Risk Warning: CFDs are complex instruments and come with a high risk of losing money rapidly due to leverage. 71% and 74% of retail investor accounts lose money when trading CFDs with Tickmill UK Ltd and Tickmill Europe Ltd respectively. You should consider whether you understand how CFDs work and whether you can afford to take the high risk of losing your money.
Futures and Options: Trading futures and options on margin carries a high degree of risk and may result in losses exceeding your initial investment. These products are not suitable for all investors. Ensure you fully understand the risks and take appropriate care to manage your risk.
Patrick has been involved in the financial markets for well over a decade as a self-educated professional trader and money manager. Flitting between the roles of market commentator, analyst and mentor, Patrick has improved the technical skills and psychological stance of literally hundreds of traders – coaching them to become savvy market operators!