Institutional Insights: Goldman Sachs Flow Of Funds Update 17/10/24
-1729171156.jpeg)
Institutional Insights: Goldman Sachs Flow Of Funds Update
GS Tactical Flow-of-Funds: Year-End Melt Up S&P 500 has hit 46 new all-time highs in 2024 and is up +42.32% from the October 27, 2023 low which is one of the best 12-month rallies in history.
There are 54 trading days left in 2024. I did not have “Spooky 6k” by Halloween24 on my Bingo Card. I think that the S&P 500 is well north of 6K by the end of the year. The equity market sell-off is canceled, and a year-end rally is starting to resonate with clients shifting from hedging from the left-tail to the right-tail. Institutional investors are getting forced into the market right now given “FOMU”: fear of materially underperforming benchmark equity indices is high. The desk is fielding questions on best implementations given a potential rally in the “Trump Trade”; this is new and broadened out the equity rally. Cyclicals also tend to outperform defensives in Q4. Next week is the Superbowl of quarterly earnings where 37% of the S&P 500 reports earnings. Investors are looking for out of favor ideas. Things that if you drop on your foot, it hurts (ouch).
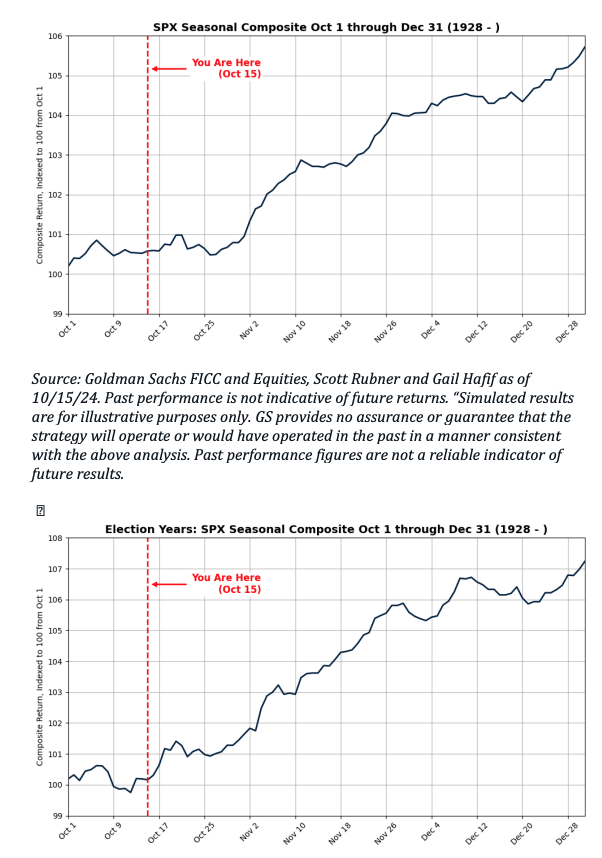
What is the seasonal median return for US equities between now and the end of the year? a. The median S&P 500 return from October 15th to December 31st is +5.17% since 1928. If we apply today’s current S&P 500 level ($5860), this implies a year-end level of $6160. b. The median S&P 500 return from October 15th to December 31st in election years is +7.04% since 1928. If we apply today’s current S&P 500 level ($5860), this implies a year-end level of $6270. c. The median NDX return from October 15th to December 31st is +12.08% since 1985. If we apply today’s current NDX level (20,439), this implies a year end level of $22,900. d. The median NDX return from October 15th to December 31st in election years is +7.29% since 1985. NDX is lower in election years when compared to non-election years. e. The median RTY return from October 15th to December 31st is +7.92% since 1979. If we apply today’s current RTY level ($2248), this implies a year-end level of $2425. f. The median RTY return from October 15th to December 31st is +10.08% in election years since 1979. RTY is higher in election years when compared to non-election years. This is the stat that will gain some attention.
Disclaimer: The material provided is for information purposes only and should not be considered as investment advice. The views, information, or opinions expressed in the text belong solely to the author, and not to the author’s employer, organization, committee or other group or individual or company.
Past performance is not indicative of future results.
High Risk Warning: CFDs are complex instruments and come with a high risk of losing money rapidly due to leverage. 71% and 74% of retail investor accounts lose money when trading CFDs with Tickmill UK Ltd and Tickmill Europe Ltd respectively. You should consider whether you understand how CFDs work and whether you can afford to take the high risk of losing your money.
Futures and Options: Trading futures and options on margin carries a high degree of risk and may result in losses exceeding your initial investment. These products are not suitable for all investors. Ensure you fully understand the risks and take appropriate care to manage your risk.
Patrick has been involved in the financial markets for well over a decade as a self-educated professional trader and money manager. Flitting between the roles of market commentator, analyst and mentor, Patrick has improved the technical skills and psychological stance of literally hundreds of traders – coaching them to become savvy market operators!