Institutional Insights: Goldman Sachs Flow Of Funds Septemeber
GS Tactical Flow-of-Funds: September – Back-to-School Correction
Goldman Sachs Head Flow trader notes, 'I am bearish on US equities starting on September 16th, however, we are starting to see this thesis start to get pre-traded by market participants as we enter September. We are seeing clients get ahead of negative market technicals sooner rather than waiting for mid-month. A market correction may start to get traction if payrolls are weak on Friday. I was pinged more times in the past 48 hours asking for technical market updates than I have all year. This is the most incoming investor question: "Why is September a historically weak month for global equities and risk assets?" I have been tracking flow of funds for over 20 years, and after the August 5th volatility event, trading styles are moving faster'
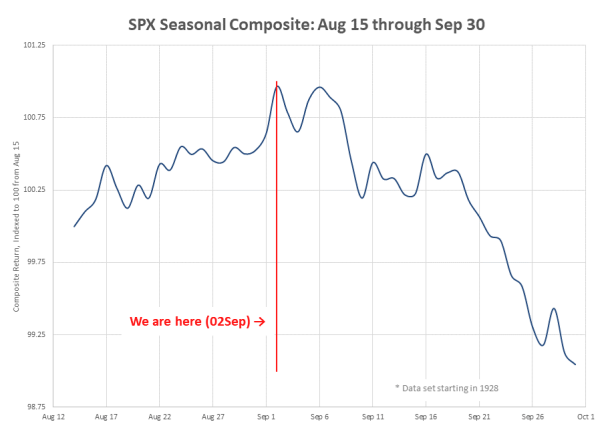
a. The second half of September is the worst two-week trading period of the year for the S&P 500.
b. Since 1928, ~100 years of data, the median S&P return is negative in the last 10 out of 11 days to close-out September. The annual weakness in September can be explained by flow-of-funds.
c. In addition, the last 4 Septembers for S&P 500 (-4.87%, -9.34%, -4.76%, - 3.92%) and NDX (-5.07%, -10.60%, -5.73%, and -5.72%) will likely bring out some recent risk-off memories of back to school trading.
d. We are entering September with local systematic length fully recovered, corporates heading into blackout, pension fund quarter-end supply, and some mutual fund year-end important dynamics.
e. In addition, global Wall Street is heading into the month higher US equity risk/VAR than we have during the last 6 election cycles.
f. It is a paper party post Labor Day - $3.2B of US Equity Supply and $43B of IG Paper (3rd largest ever) yesterday, our desk remains active.
Over the next 1 week: Red Wave for US stocks.
a. Flat tape: SELLERS –$93M (-$3.02B out the US)
b. Up tape: Buyers +$1.791B (-$2.97B out the US)
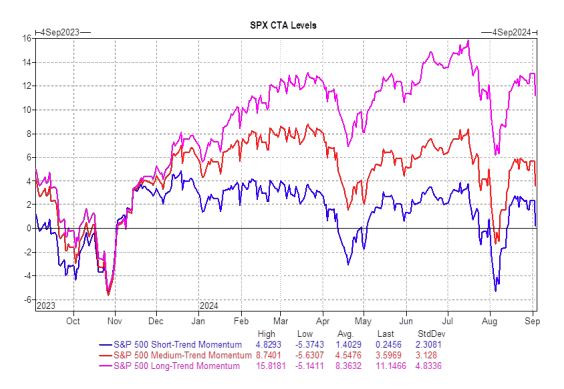
c. Down tape: Sellers -$33.458B (-$3.85B out the US) Over the next 1 month - CTA exposure is skewed to the downside.
d. Flat tape: Sellers -$28.332B (-$17.38B out the US)
e. Up tape: Buyers +$11.497B (-$3.73B out the US)
f. Down tape: Sellers -$194.6B (-$65.55B out the US)
Threshold levels have been broken – this is new
NDX - CTA short-term threshold level = 19,345 (We are below this level)
RTY - CTA short-term threshold level = 2150 (We are below this level)
SPX - CTA short-term threshold level = 5515 (we are below this level premarket)
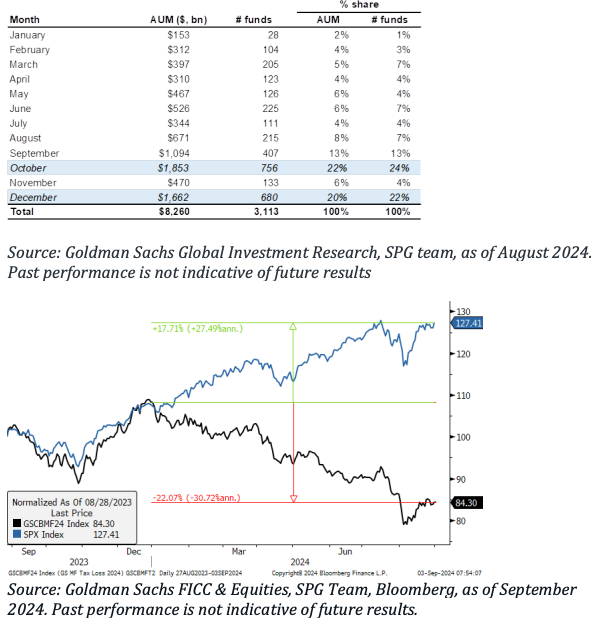
September Quarter-End Pension Rebalancing
According to the Milliman Top 100 Pension Funding Index, pensions are 103% funded. We have consistently seen pension funds reduce equity risk and immunize liabilities while moving into investment grade credit. Pension funds have been reducing equity risk ahead of the US election given funded status
Capital Gains Laggards October is the year’s largest active mutual fund fiscal year-end month, reaching nearly 22% of total assets under active management, followed by December (~20% of total) according to GS Research study of 554 large-cap mutual funds with a combined $3.7 trillion in equity assets. This could adversely affect (or already be affecting) price action in popular mutual fund over weights with potential tax-loss selling of ytd underperformers and trimming/profit taking in ytd outperformers. Our 2024 Mutual Fund Tax Loss basket {GSCBMF24 Index} is composed of equities most held by mutual funds that have sold off the most year-to-date and is liquid at $500m per day with no name exceeding 10% of ADV. The basket is down -22% ytd where, as the S&P 500 is up +18%.
Disclaimer: The material provided is for information purposes only and should not be considered as investment advice. The views, information, or opinions expressed in the text belong solely to the author, and not to the author’s employer, organization, committee or other group or individual or company.
Past performance is not indicative of future results.
High Risk Warning: CFDs are complex instruments and come with a high risk of losing money rapidly due to leverage. 71% and 74% of retail investor accounts lose money when trading CFDs with Tickmill UK Ltd and Tickmill Europe Ltd respectively. You should consider whether you understand how CFDs work and whether you can afford to take the high risk of losing your money.
Futures and Options: Trading futures and options on margin carries a high degree of risk and may result in losses exceeding your initial investment. These products are not suitable for all investors. Ensure you fully understand the risks and take appropriate care to manage your risk.
Patrick has been involved in the financial markets for well over a decade as a self-educated professional trader and money manager. Flitting between the roles of market commentator, analyst and mentor, Patrick has improved the technical skills and psychological stance of literally hundreds of traders – coaching them to become savvy market operators!