Institutional Insights: Goldman Sachs 'Crypto Powering On'
Market Update: U.S. Equities, Gold, and Cryptocurrency Trends
The U.S. equity markets are experiencing strong momentum, with the S&P 500 marking its seventh consecutive day of gains, despite the recent government shutdown that commenced last Wednesday. Investors have largely remained unfazed by this political uncertainty.
#### Gold Market Insights
Gold has reached new heights, surpassing $3,975 per ounce, prompting Goldman Sachs Research to raise its December 2026 price forecast to $4,900 per ounce. This bullish outlook is supported by a resurgence in central bank purchases and significant inflows into gold ETFs. Emerging market central banks are expected to continue diversifying their reserves into gold, reinforcing its status as a safe haven asset.
#### Bitcoin Performance
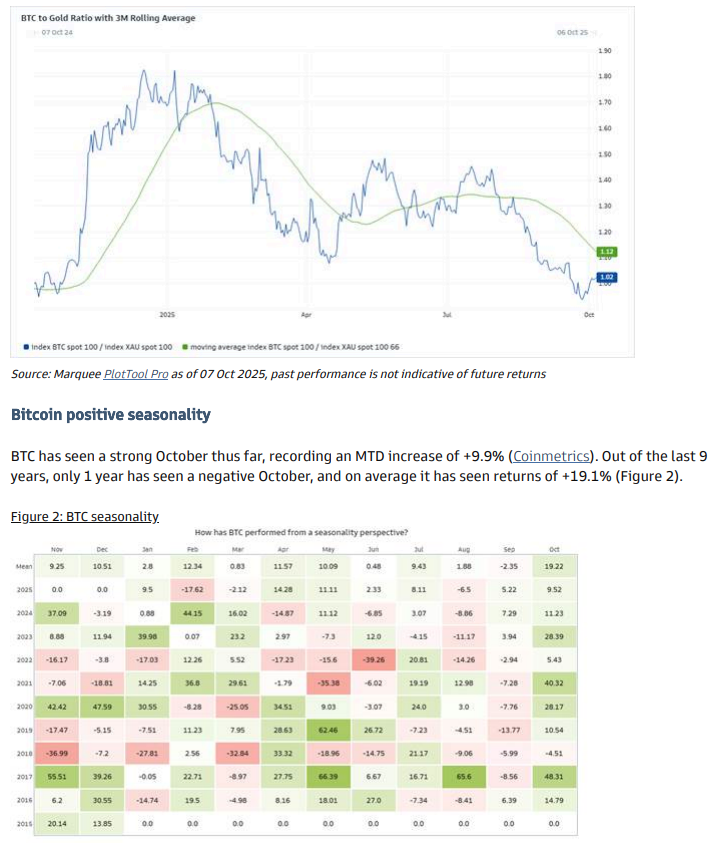
Bitcoin has also surged, hitting fresh all-time highs above $126,000, driven by strong ETF inflows. Historically, both Bitcoin and gold have thrived during periods of global fiscal uncertainty, particularly concerning debt sustainability in developed economies. Recently, however, the structural dynamics appear to favor gold more prominently.
While Bitcoin has benefited from a dual narrative as both a risk-on asset and a diversification tool, its year-to-date increase of 25% pales in comparison to gold's impressive 50% rise. This disparity has resulted in the BTC-to-gold ratio remaining below its three-month rolling average, currently sitting at a yearly low.
#### Cryptocurrency Market Overview
Beyond Bitcoin and Ethereum, the total market capitalization of cryptocurrencies has comfortably surpassed $4 trillion, currently sitting at $4.31 trillion, reflecting a 26.5% increase year-to-date. Layer-1 blockchain tokens have shown robust recovery since September, with the GMCI Layer-1 index rising by 6.5%.
Digital Asset Treasuries (DATs)
Digital Asset Treasuries (DATs), which are public companies holding cryptocurrencies on their balance sheets, have consistently increased their allocations. According to third-party trackers, corporations collectively own over 1 million BTC and approximately 5.7 million ETH, predominantly concentrated among listed firms (source: bitcointreasuries.net, The Block).
Unlike traditional spot ETFs, DATs have the ability to directly monetize their holdings. For Ethereum (ETH), this is primarily achieved through staking rewards, while Bitcoin (BTC) holders often utilize option-selling programs. These strategies have been noted for contributing to lower implied and realized volatility by increasing the supply of options and reducing volatility risk premia.
#### Premiums and Market Dynamics
At times, several DATs have traded at significant premiums relative to the value of their underlying assets. However, as more DATs have entered the market, these premiums have generally compressed. Issuers have strategically raised equity or debt to finance additional cryptocurrency purchases when their trading multiples exceed net asset value (NAV) (source: The Block).
#### Positive Trends in Spot Demand
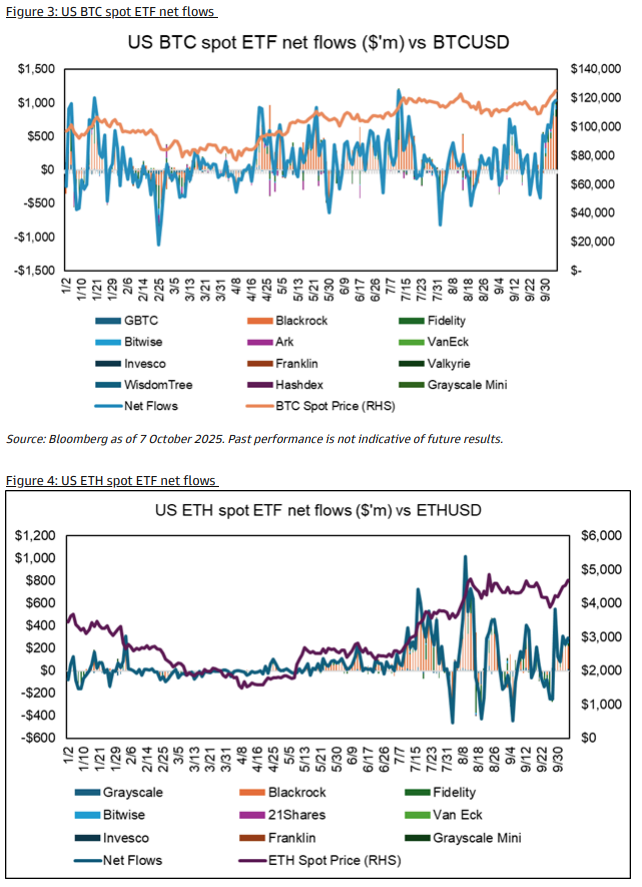
In addition to DATs, spot demand from cryptocurrency ETFs has been on an upward trajectory. Over the past six consecutive trading sessions, both Bitcoin and Ethereum spot ETFs have experienced daily positive net inflows. Month-to-date, these inflows have totaled approximately $3.3 billion for Bitcoin and $892 million for Ethereum (source: Bloomberg). Currently, the assets under management (AUM) for spot BTC and ETH ETFs stand at $163 billion and $32 billion, respectively.
Leverage Trends in October: Funding Rates for Bitcoin and Ethereum
As we enter October, funding rates in the cryptocurrency market, particularly for Bitcoin and Ethereum, have shown a historical correlation with price movements. This relationship remains evident, indicating that leverage dynamics are influencing market behavior.
Bitcoin Funding Rates
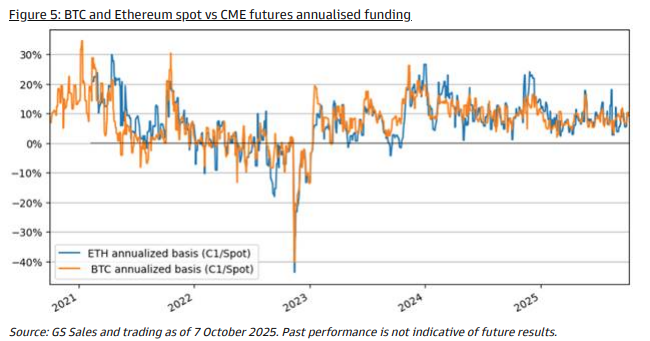
The CME funding rate for Bitcoin has recently surpassed 10%, a notable increase from the 7.5% range where it has spent most of the year. This uptick suggests a growing demand for leverage as traders position themselves for potential price movements (see Figure 5).
Ethereum Funding Rates
Similarly, the funding rate for Ethereum has stabilized around the 10% mark. This consistency indicates that traders are also leveraging their positions in ETH, reflecting confidence in its price trajectory (see Figure 5).
Current Cycle Analysis: Bitcoin Halving Events and Market Outlook
Historically, Bitcoin halving events have been pivotal in initiating bull cycles for Bitcoin and the broader cryptocurrency market. With a decade of data to analyze, we can draw insights from the three previous halving events.
Historical Halving Events
First Halving: July 9, 2016
Price Movement: After this halving, Bitcoin took 525 days to reach a closing high of $19,640 on December 16, 2017.
Second Halving: May 11, 2020
Price Movement: This halving led to a 546-day period before Bitcoin hit a cycle high of $67,541 on November 8, 2021. However, this was followed by a significant market crash and a prolonged bear market. It took an additional 1,402 days from the halving for Bitcoin to achieve fresh all-time highs of $73,081 on March 13, 2024, coinciding with the introduction of Bitcoin ETFs.
Third Halving: April 19, 2024
Current Status: As of now, it has been 536 days since the latest halving event. While this duration aligns with historical trends leading up to a cycle top, the market dynamics may have shifted due to the introduction of Bitcoin ETFs, which could alter the typical price trajectory.
Market Outlook
The outlook for Bitcoin appears constructive; however, several risks could impact the sustainability of this price momentum:
Lack of Clear Catalysts: There has not been a distinct idiosyncratic catalyst driving the recent Bitcoin price surge, which raises questions about the durability of the move.
Macro Risks: Three key macroeconomic factors could potentially derail the current price action:
U.S. Jobs Market Data: Any worsening in job market indicators could negatively impact investor sentiment.
Correlated U.S. Equity Markets: The sustainability of Bitcoin's price may be tied to the performance of U.S. equities, particularly the ongoing AI trade, which relies on demand and capital expenditure (capex) spending.
Upcoming Q3 Earnings Season: Corporate earnings reports may reveal headwinds to profits, particularly due to tariffs, which could influence market sentiment and trading behavior.
Disclaimer: The material provided is for information purposes only and should not be considered as investment advice. The views, information, or opinions expressed in the text belong solely to the author, and not to the author’s employer, organization, committee or other group or individual or company.
Past performance is not indicative of future results.
High Risk Warning: CFDs are complex instruments and come with a high risk of losing money rapidly due to leverage. 71% and 74% of retail investor accounts lose money when trading CFDs with Tickmill UK Ltd and Tickmill Europe Ltd respectively. You should consider whether you understand how CFDs work and whether you can afford to take the high risk of losing your money.
Futures and Options: Trading futures and options on margin carries a high degree of risk and may result in losses exceeding your initial investment. These products are not suitable for all investors. Ensure you fully understand the risks and take appropriate care to manage your risk.
Patrick has been involved in the financial markets for well over a decade as a self-educated professional trader and money manager. Flitting between the roles of market commentator, analyst and mentor, Patrick has improved the technical skills and psychological stance of literally hundreds of traders – coaching them to become savvy market operators!